Visualize MCAP data in Grafana with ReductStore (extract on query)
1. What you'll learn
MCAP is becoming the default "flight recorder" format for robotics: it is compact, portable, and great for capturing many ROS 2 topics over time. The problem is that most observability tooling (dashboards, alerts, and reports) expects time-series-shaped data, not a log container format.
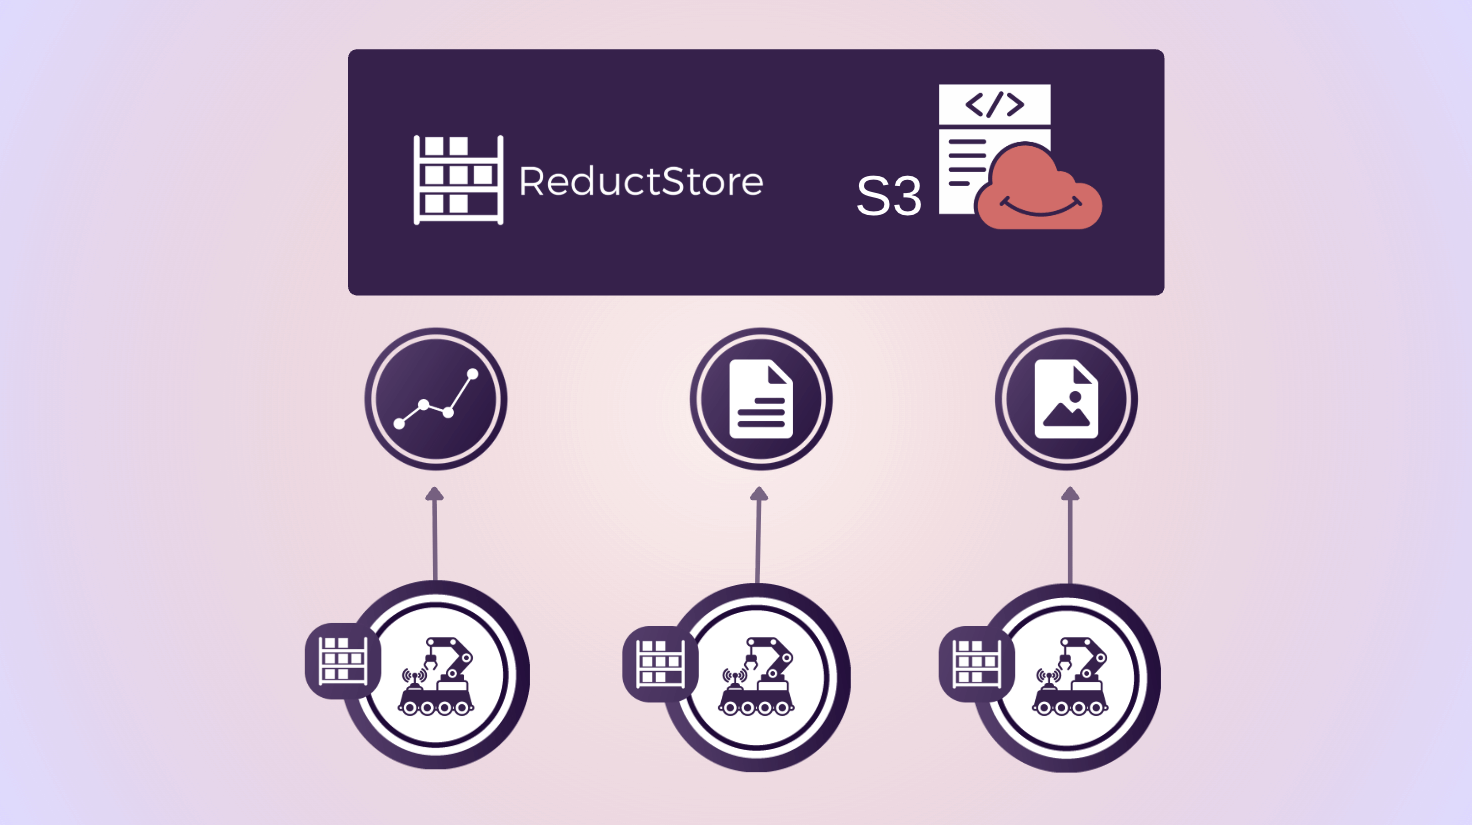
In practice, teams usually either store a second copy of the same signals in a time-series database (TSDB) for observability (while keeping MCAP separately for debugging and offline analysis), or they keep everything in MCAP and use ReductStore to query and extract the pieces they need for observability so the data stays in one place and the infrastructure stays simpler.
In this post, we'll keep your data in MCAP end-to-end: store the files in ReductStore, then use the ReductROS extension's extract feature to turn a single ROS topic into a stream of JSON records that Grafana can query and visualize.
By the end, you'll know how to:
- How to connect Grafana to ReductStore with the data source plugin
- How to query MCAP data stored in ReductStore and extract a ROS 2 topic as JSON records
- How to turn extracted JSON into Grafana panels (tables and time series)
2. What we'll build
We'll create a Grafana dashboard backed by the ReductStore data source plugin. The dashboard will read an MCAP entry directly from a ReductStore bucket, then use a conditional query with #ext and ros.extract to decode a chosen ROS 2 topic into a stream of JSON records.
Once we have JSON in Grafana, we'll build a couple of practical panels: a table panel to validate the payload and metadata, and time-series panels driven by extracted numeric fields (for example, IMU readings, odometry, or battery metrics).
3. Prerequisites
To follow along, you don't need a fancy setup: a local ReductStore instance, a sample MCAP file, and a running Grafana are enough. The key requirement is that your MCAP contains ROS 2 messages encoded in CDR, so the ReductROS extension can decode them and return JSON that Grafana can work with.
- ReductStore running with a bucket containing an MCAP entry
- ReductROS extension installed/enabled (ROS 2 MCAP messages encoded in CDR)
- Grafana 10+ with the ReductStore data source plugin installed (unsigned plugin configuration)
4. Step 1: Store MCAP in ReductStore
- Suggested naming scheme: bucket per robot/project, entry per run/session
- Suggested labels at ingest time:
robot_id,run_id,site,env,vehicle,mission, etc.
5. Step 2: Connect Grafana to ReductStore
Grafana talks to ReductStore through the ReductStore data source plugin.
First, make sure you're running Grafana 10+ and allow the plugin to load. At the moment, the plugin is installed manually (not from the Grafana Marketplace), so you need to enable unsigned plugins in grafana.ini:
[plugins]
allow_loading_unsigned_plugins = reductstore-datasource
Then install the plugin:
- Download the ZIP from the ReductStore Grafana plugin releases page: https://github.com/reductstore/reduct-grafana/releases
- Extract it to your Grafana plugins directory (commonly
/var/lib/grafana/pluginson Linux) so you get areductstore-grafanafolder there. - Restart Grafana (for example,
sudo systemctl restart grafana-server, or restart your Grafana container). - Check Grafana logs if it doesn't show up (e.g.,
journalctl -u grafana-server | rg reductstoreordocker logs <grafana-container> | rg reductstore).
Once Grafana is running with the plugin installed, add ReductStore as a data source:
- In Grafana, go to "Add new connection" and search for "ReductStore".
- Set the Server URL (for example,
http://localhost:8383). - Add an API token if your ReductStore instance requires authentication.
- Click "Save & Test" to verify the connection.
6. Step 3: First extraction query (Grafana Explore)
Start with a narrow time range to validate data quickly. In Grafana Explore, select query mode "Content only" (or "Labels and Content" while debugging), and paste the following conditional query:
{
  "#ext": {
    "ros": {
      "extract": {
        "topic": "/imu/data",
        "as_label": {
          "vel_x": "angular_velocity.x",
          "vel_y": "angular_velocity.y",
          "vel_z": "angular_velocity.z"
        }
      }
    },
    "when": {
      "$each_t": "1s",
      "@vel_x": { "$gt": 0 }
    }
  }
}
This query extracts /imu/data from the MCAP content, promotes the IMU angular velocity components to computed labels (so they are easy to filter and graph), and samples the result every 1 second.
7. Step 4: Build panels from extracted JSON
- Table panel first:
- Verify timestamps, labels, and JSON payload shape
- Time-series panel:
- Extract numeric fields from the JSON payload via Grafana transformations
- Plot common signals (IMU axes, velocities, battery voltage, localization errors)
8. Step 5: Make it dashboard-friendly
- Dashboard variables sourced from labels (robot/run/topic)
- Query patterns:
- Prefer label filtering to reduce how much MCAP content must be processed
- Use
#select_labelsto keep only the labels you need in Grafana
9. Step 6: Scale and performance
- Use Grafana
$__intervalwith$each_tfor interval-based queries - Tips for large bags:
- Keep time ranges tight for interactive dashboards
- Avoid extracting from many large episodes at once; filter first
10. Optional: Visualize binary topics (images)
- Use
ros.extract.encode(e.g., JPEG encoding forsensor_msgs/Image) - Panel strategy:
- Table + links / inspect view
- Consider separating image topics into their own dashboard
11. Troubleshooting checklist
- Grafana plugin not loading (unsigned plugin setting, restart Grafana, check logs)
- "No data":
- Wrong bucket/entry
- Wrong topic name
- MCAP is not ROS 2 CDR / schema mismatch
- Timeouts:
- Narrow time range, add label filters, and reduce extracted fields
12. Wrap-up and next steps
- Summary: MCAP in ReductStore + extract on query + Grafana dashboards/alerts
- Next steps:
- Add alerts on extracted signals
- Use
ros.transformto generate filtered MCAP episodes for downstream tooling (Foxglove/offline analysis)